Stream COSMOS Commands and Telemetry into Any Observability Platform with OpenTelemetry
%20-%20OpenC3.com.png)
Picture a Saturday night satellite contact. A satellite operator is watching live telemetry in COSMOS while, two floors away, the SRE team is staring at Grafana and Kibana dashboards covered in microservice metrics. A subsystem starts misbehaving. Was it the spacecraft? A network blip in the ground segment? A backend deploy from an hour ago? Answering that shouldn’t take three browser tabs and a phone call.
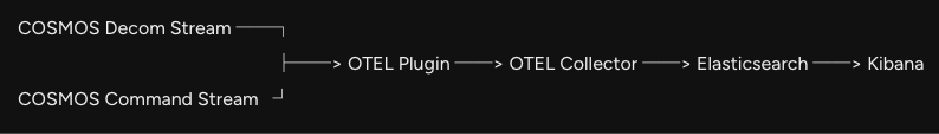
The new OpenC3 COSMOS OpenTelemetry Metrics Plugin closes that gap. It takes the telemetry and commands already flowing through COSMOS and ships them, in real time, into Elasticsearch, Datadog, Splunk, etc. — where dashboards can chart, search, and alert on them alongside everything else the team already monitors.
Why it Matters
Many COSMOS deployments end up with two parallel observability worlds. Mission data lives inside COSMOS. Infrastructure, services, and cloud workloads live in a stack like Elasticsearch, Datadog, or Splunk. Each side is great at its job, but the boundary between them is where investigations stall and dashboards stop being useful to leadership.
Closing that gap used to mean writing a custom exporter and maintaining it forever. The COSMOS OpenTelemetry Metrics plugin replaces that work by speaking OpenTelemetry (OTEL) — the industry-standard format for metrics and traces. OTEL is intentionally backend-agnostic: the same data stream can land in Grafana, Splunk, Datadog, Honeycomb, New Relic, or any other OTLP-compatible tool. For the rest of this post, the worked examples use Elasticsearch and Kibana, since that’s the stack the plugin ships with out of the box.
What the COSMOS Plugin Does
Numeric telemetry items become OTEL metrics: time series data Kibana can chart, alert on, or correlate against other data. Commands become OTEL traces — each command sent is recorded as a span with the target, packet, and parameters attached as searchable attributes.
Importantly, the plugin is a read-only consumer of the streams COSMOS already produces. It doesn’t sit in the command path and it doesn’t modify core code. Remove it and COSMOS keeps running exactly as before. New targets are picked up automatically and deleted ones are cleaned up.
Telemetry You Can Chart
Each numeric telemetry item becomes its own time series, named like TLM__<TARGET>__<PACKET>__<ITEM>, with target_name and packet_name attached as attributes. Converted values are used, so what shows up in Kibana matches what operators see in COSMOS.
Commands You Can Search
Every command produces a span named send_command, with the target, packet, key metadata, and every parsed command parameter recorded as attributes. COSMOS can already answer "what commands did we send?" on its own. The win here is correlation. Once commands are spans in Elasticsearch, they sit on the same timeline as ground-segment logs, Kubernetes events, and network metrics. Questions like "Did this fault line up with a deploy?" or "was the ground network degraded when we sent that sequence?" stop being multi-tab investigations and become single-pane queries.
Easy to stand up
The plugin ships with a working Elasticsearch, Kibana, and OTEL Collector stack via Docker Compose, ready to bring up alongside COSMOS. Three plugin variables cover most installations:
Because the plugin emits standard OTLP, pointing the data at Grafana, Splunk, Datadog, or anything else later is a Collector config change — not a code change. Teams aren’t locked into one observability platform.
Back to That Saturday Night...
Same operator, same fault — but both teams are now looking at the same Kibana dashboard. Spacecraft temperature, backend latency, and ground-network errors are stacked on a single timeline. The cause becomes obvious in seconds rather than minutes, and leadership gets a single view instead of three.
Key Takeaways
- Stream COSMOS telemetry and commands into any modern observability platform via OpenTelemetry
- Telemetry items become metrics; commands become trace spans with full parameter detail
- Read-only consumer of existing streams, zero impact on the command path or core code
- Standard OTLP under the hood, so Elasticsearch, Grafana, Splunk, Datadog, and other backends are all on the table
Grab the plugin for Enterprise customer and try it against your stack.
Stay up to date on all COSMOS and OpenC3 news by subscribing to our newsletter!